

Key facts and figures about the Service sector are now available in a set of easy-to-view infographics.
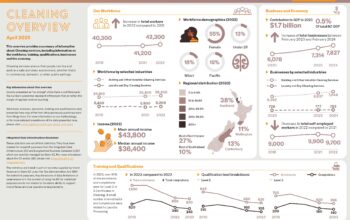
The Ringa Hora Workforce Insights team has assembled 11 infographics, each of which displays key data about selected service sector industries’ economic size and characteristics, workforce, and information about people undertaking training and qualifications within that industry.
Where appropriate, breakdowns of the numbers are included, by employment type, gender, age group, ethnic group, and region.
The Service Sector Overviews are all available for download on the Ringa Hora website.
We are also publishing Excel data files showing the data which formed the basis of these graphics. They should be useful for anyone wanting key figures about their industry.
This release marks the first release of these infographics, with a second release planned for later in 2025.
This upcoming release will incorporate more recent data as it becomes available, as well as providing overviews for more specific groupings of service sector industries, and some industries not included within this release.
For any questions about this publication, please contact [email protected].